Fire in the Protected Areas
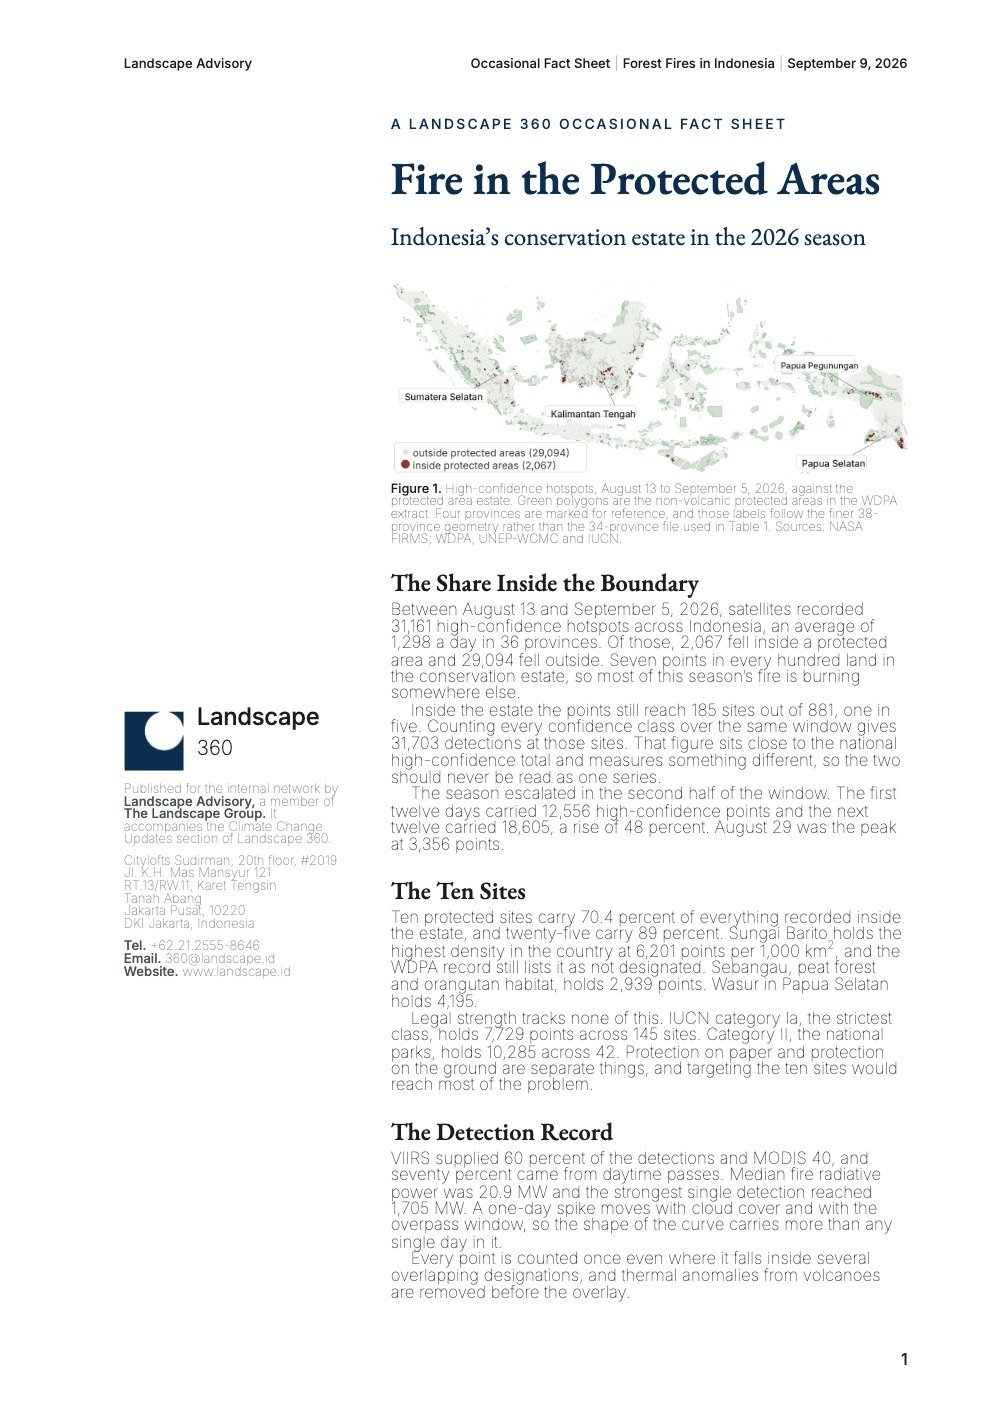
Indonesia’s conservation estate in the 2026 season: 2,067 high-confidence hotspots inside the estate, ten sites carrying 70 percent of them.
Download →Measuring Indonesia’s 2026 fire season while it burns — where the fire is, what it is costing, and who is carrying the bill.
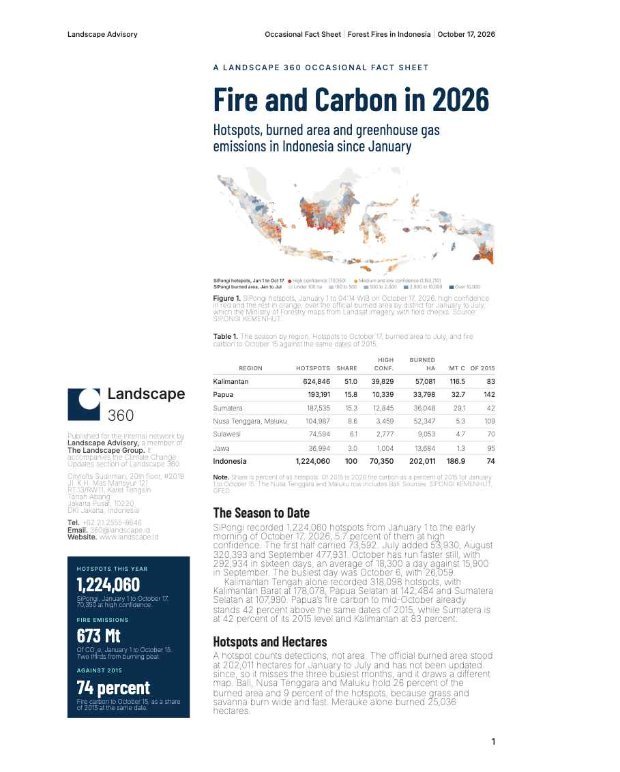
The 2026 season is being recorded as it happens, from satellite detections through health costs to the modelled hit to output, and published in short intervals rather than held for a year-end report.
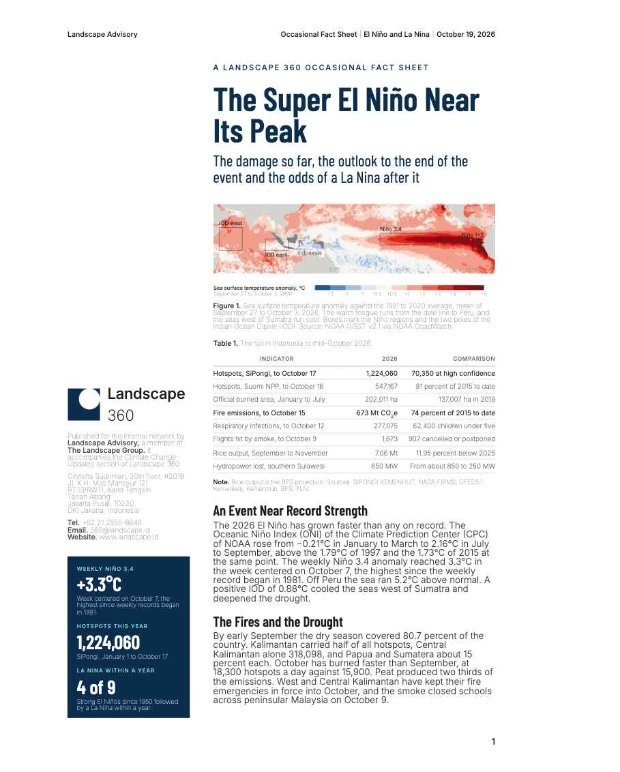
Fire in Indonesia is a recurring economic event with a predictable trigger. A strong El Niño dries peat that was drained for cultivation, and land that is cleared with fire in a dry year does not stop at the boundary of the plot. The damage then travels: haze closes schools and airports, respiratory admissions rise across the region, harvests fall, and the fiscal cost of response and reconstruction competes with planned spending.
What is usually missing during a season is the number. Hotspot feeds report detections without attribution; health effects are estimated long after the smoke clears; and the economic cost is settled in retrospect, when the decisions it should have informed have already been taken. This initiative closes that gap by publishing the measurement continuously — the count, where it falls, what it costs, and what the modelling says happens next.
Four instruments, each answering a different question, and each published with its method attached.
Detection. NASA FIRMS hotspots from VIIRS and MODIS, filtered to high confidence, counted daily and by province, with volcanic thermal anomalies removed. Each point is counted once even where designations overlap.
Exposure. The same detections overlaid on the protected area estate from the WDPA extract, so the share of fire burning inside the conservation estate — and which specific sites carry it — is visible rather than inferred. Density is computed against the protected area itself, not the province.
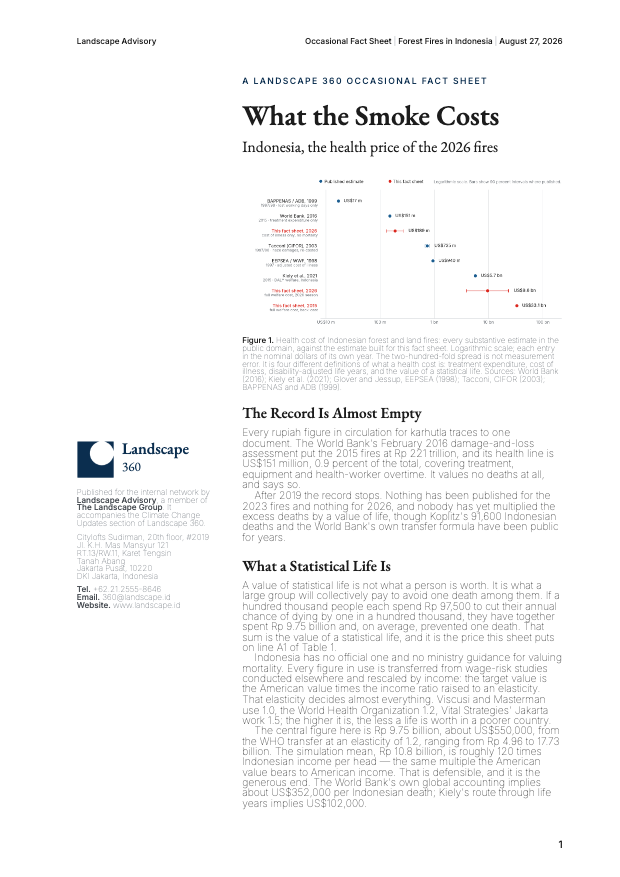
Health and fiscal cost. The population exposed to elevated particulate concentrations, the resulting respiratory burden, and the public cost of treating it. The August 2026 fact sheet put the health burden at Rp120 trillion and prompted the call for systemic rather than seasonal response.
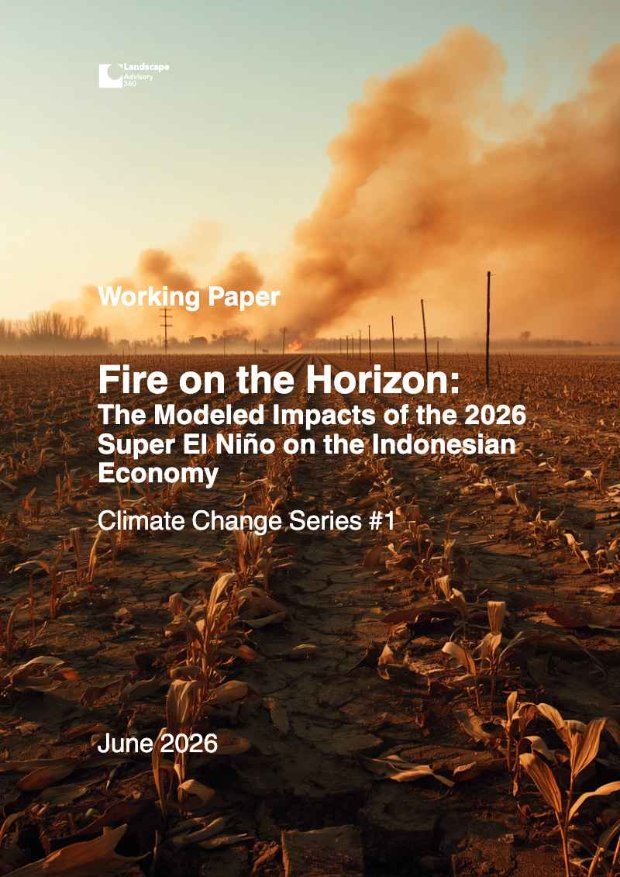
Economy-wide impact. ENSOID26, a calibrated system-dynamics model of how a super El Niño propagates through the Indonesian economy — the finding being that the indirect wave through supply chains, prices and public budgets costs more than the burned area itself.
The 2026 season escalated sharply in the second half of August, and the pattern it exposed is not the one policy is built around.
Between 13 August and 5 September, satellites recorded 31,161 high-confidence hotspots nationally. Of those, 2,067 fell inside a protected area — seven in every hundred — so most of the season’s fire is burning outside the conservation estate. But inside the estate, ten sites carry 70.4 percent of everything recorded, and legal category tracks none of it: the strictest IUCN class holds more points across more sites than the national parks do.
Two provinces hold 62 percent of the hotspots recorded inside protected areas. Papua has the volume, spread across an enormous estate; Kalimantan Tengah has the density, four times as many points per unit of protected land. The five Kalimantan provinces together hold more than half the national figure.
That combination — concentration in a small number of sites, and density rather than count as the operative measure — is what makes targeted intervention possible. Protection on paper and protection on the ground are separate things, and the difference is now measurable while the season is still running.
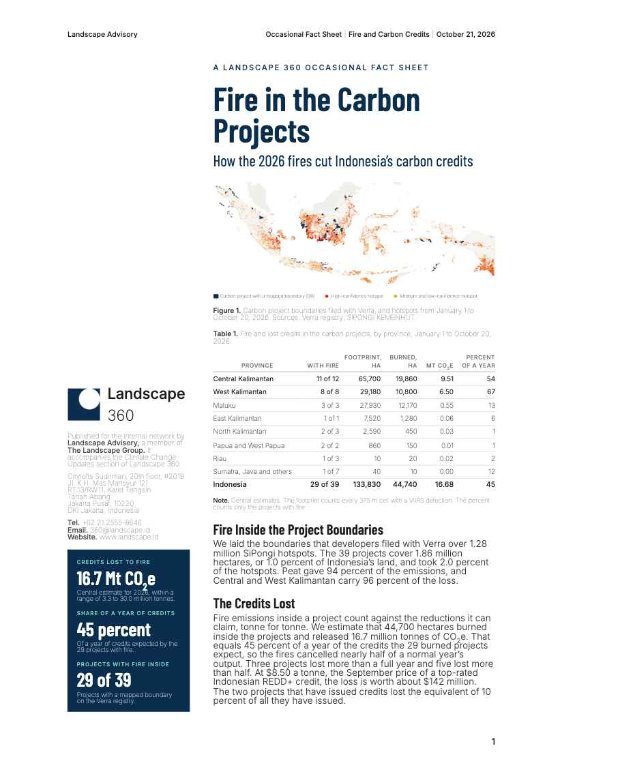
Indonesia’s conservation estate in the 2026 season: 2,067 high-confidence hotspots inside the estate, ten sites carrying 70 percent of them.
Download →
Indonesia, the health price of the 2026 fires.
Download →
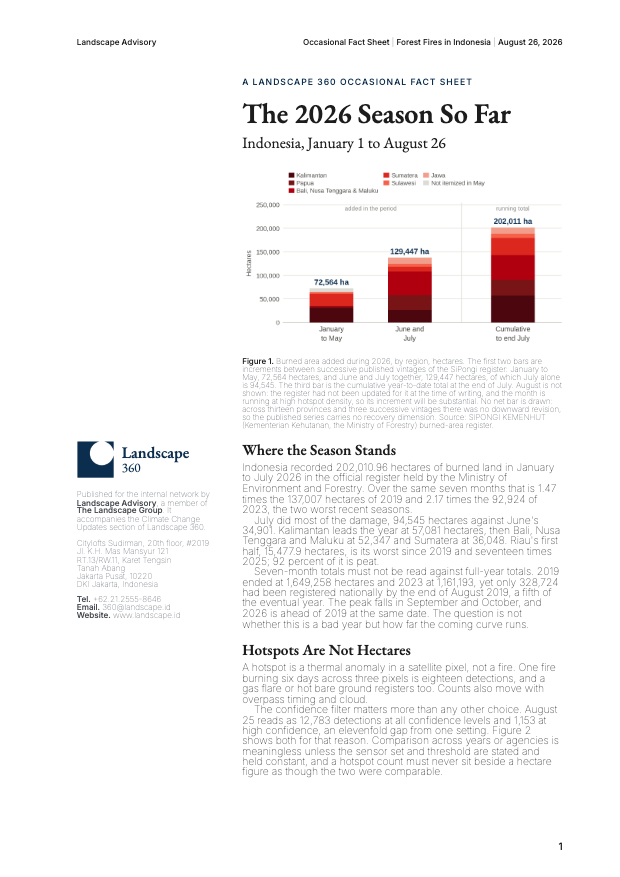
Indonesia, January 1 to August 26.
Download →
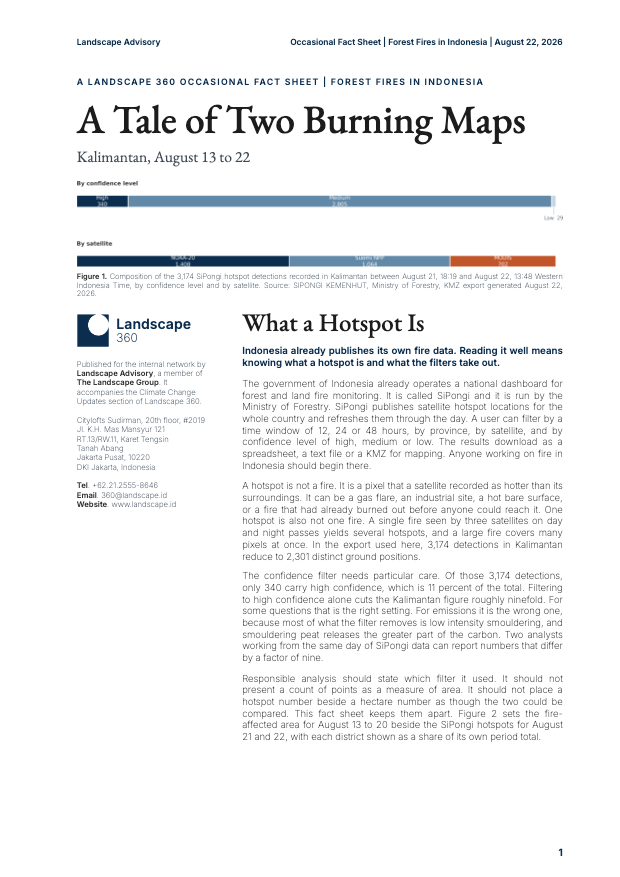
Kalimantan, August 13 to 22.
Download →
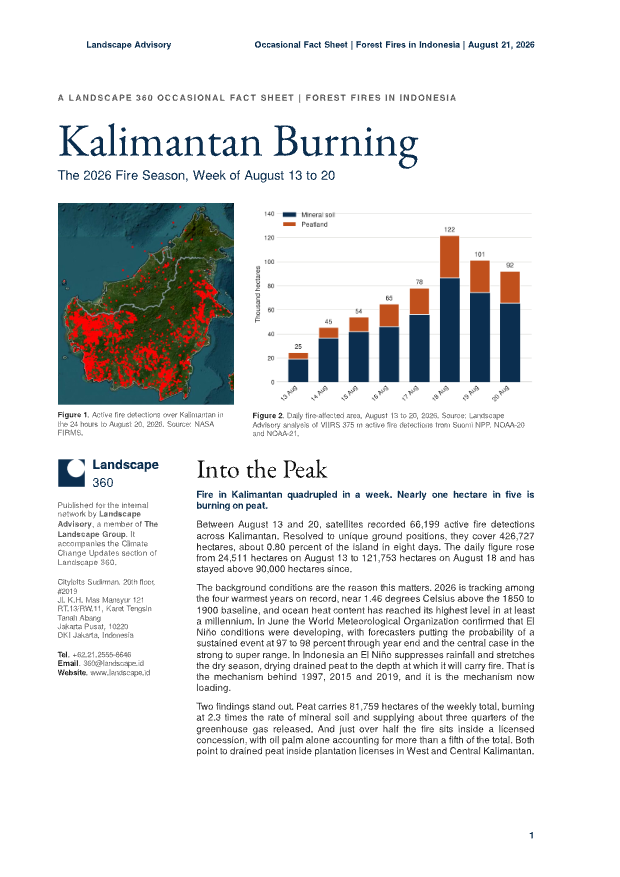
The 2026 fire season, week of August 13 to 20.
Download →
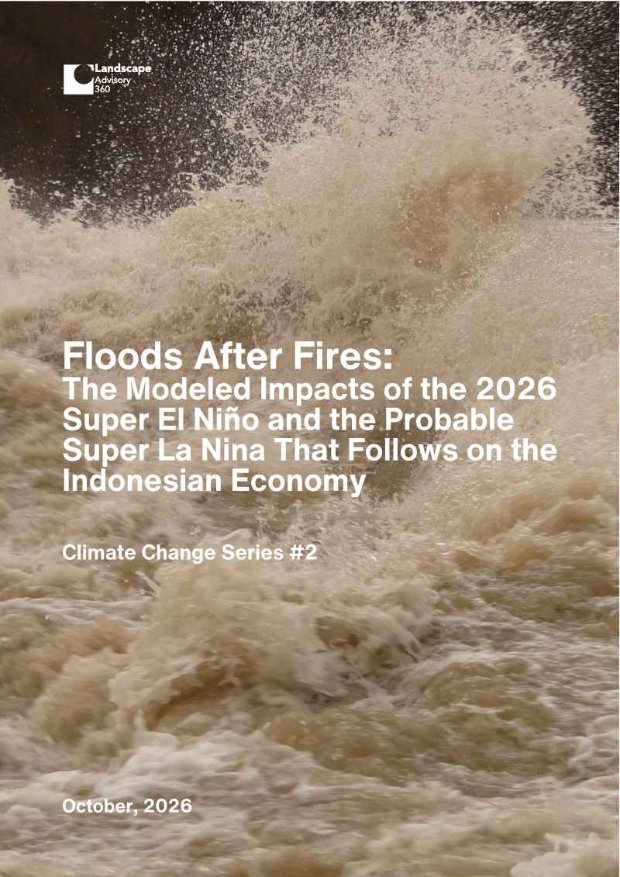
The modelled impacts of the 2026 super El Niño on the Indonesian economy — why the indirect wave costs more than the scorched fields. Includes the ENSOID26 system dynamics model.
Read →
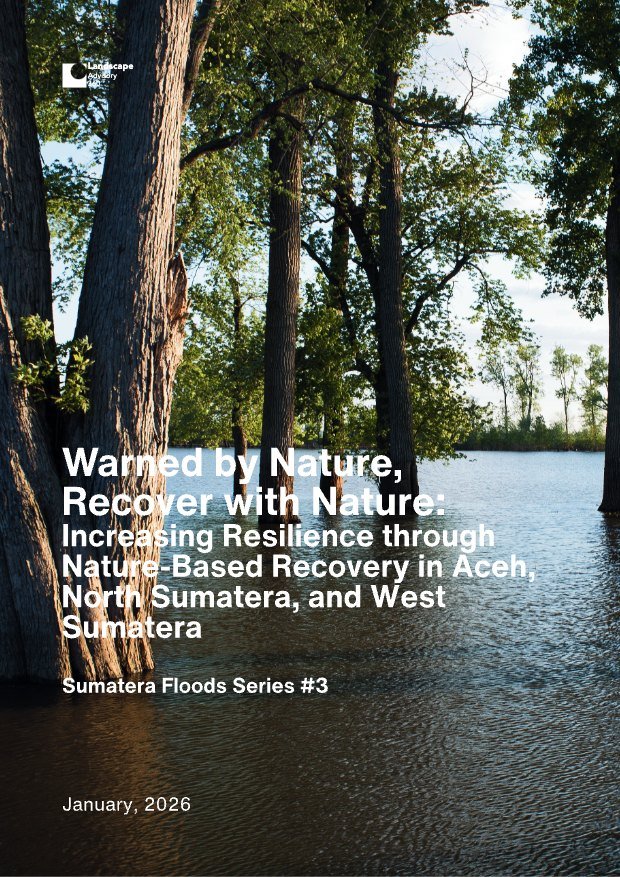
Increasing resilience through nature-based recovery in Aceh, North Sumatera, and West Sumatera.
Read →Press coverage of the fire findings, including the Rp120 trillion health burden and the call for systemic response.
Where the peat, fire management and ecosystem service work sits, and the projects it runs.
The land-use pressure behind the clearing: food security, biodiesel feedstock and the FOLU Net Sink target on one map.